Advance Interactive Visuvalization
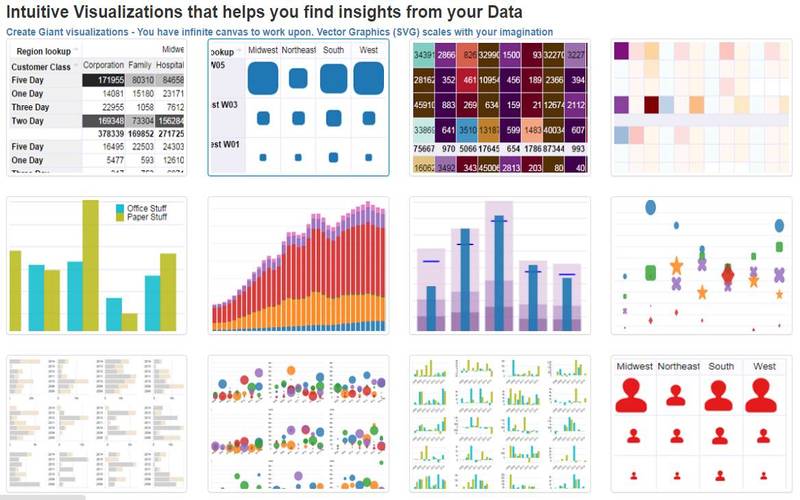
With the rise of unstructured data, there is too much of information available to visualize it effectively using conventional BI query and analysis techniques. New generation of data visualization techniques have arrived in the market that allow business users to access business intelligence and analytics data in more easy to understand formats. Advanced Interactive Visualization techniques also offer innovative ways to explore data, through visuals like geospatial analysis, heat maps, tree maps, bubble charts and word clouds.
Challenges
In a distributed organization structure the datasets are often large and complex and include variety of identifiers and hidden insights. The visualization becomes more challenging as we move towards the small screens of handheld devices. We have identified few of the challenges faced while setting up an advanced data visualization interface:

Right Tool Selection
The availability of multiple tools with unique functionalities makes it very difficult to choose the most suitable tool for the business.
Analysis of Big Data sets
It is very important to understand the infrastructure needs to analyze the huge set of data without compromising on the performance
Complex Tools
Most of the times organizations struggle with the existing technical competency to implement and integrate new and complex visualization tools
Hidden Insights without Data Visualization
Conventional BI tools and techniques restrict the users to discover hidden patterns within the data without appropriate visualization design and interface.
Visualize Data Points on a Single Screen
When you have numerous data points it becomes challenging task to find the patterns and correlations by navigating through the data on a single screen.